Why Quality Scientific Writing Matters
When approaching scientific report writing, one guiding principle stands above all others: focus on the reader. Whether preparing an internal technical document or a manuscript for publication, prioritize the needs of the person who will read the work. From their perspective, we are communicating across distance and time, with only written words to convey the message. We cannot clarify misunderstandings or add explanations as they read. The report must stand independently and communicate effectively on first reading. The reception of the work, its scientific impact, and potentially professional advancement may hinge on how effectively readers understand the report during their brief engagement with it. This perspective should emphasize the importance of taking writing seriously.
Contemporary scientific writing has largely moved away from impersonal, passive constructions. Instead, straightforward language often works best: “We measured the fall time using a millisecond-precision electronic timer.” With no single “correct” approach to report writing, choose language that communicates most clearly and engagingly. For additional guidance on effective writing, consider consulting Strunk and White’s classic text referenced in the Bibliography.
Let’s examine each report section from the reader’s perspective.
Title
Addressing these elements typically results in an effective title.
Format
Now let’s examine each section’s specific requirements.
Introduction
Topic Statement
With a well-crafted title having captured reader attention, remember that readers likely begin with minimal knowledge of the specific experiment. Rather than immediately diving into experimental details, begin with a broad framing statement. For example: “It is possible to measure gravitational acceleration by observing a simple pendulum’s oscillation.” This approach guides readers from their initial unfamiliarity to a clear understanding of the work’s focus.
Review of Existing Information
At this point, readers need contextual background. Provide a concise summary of relevant knowledge, potentially including historical context or previous experimental findings. Two elements must appear in every experimental report: a clear description of the system and experimental conditions, and an explanation of the theoretical model(s) employed.
Keep this background information concise to maintain focus on the main argument, while ensuring readers have sufficient context to understand the work. Standard theoretical derivations should be omitted, but the resulting equations and their limitations should be included. For example: “It can be demonstrated that for vanishingly small oscillation amplitudes, a simple pendulum (modeled as a point mass on a massless, inextensible string) has a period given by...”. If readers might need derivation details, cite an appropriate reference.
Application of Information to Specific Experiment
Having established context, readers will wonder how this background relates to the specific experiment. Explain how general principles apply to the particular work. This often involves showing how theoretical equations can be transformed into a useful experimental framework, such as rearranging equations into straight-line form for graphical analysis. Identify how system-model comparisons will be made and what information can be extracted from parameters like slopes and intercepts. This preparation ensures readers understand how the final results will be obtained.
Summary of Experimental Intention
Conclude the introduction by summarizing the specific experimental goals. For example: “Thus, by measuring refractive index variation with wavelength, we can test Cauchy’s model using n versus 1/λ² graphical analysis. The Cauchy coefficients A and B for our glass specimen will be determined from the graph’s intercept and slope, respectively.” This summary provides readers with a framework for understanding the experimental procedure that follows, particularly valuable in complex reports with extended introductions.
Statement of Experimental Purpose
While not mentioned above, include a clear purpose statement somewhere in the introduction. Its placement depends on context. For familiar topics, it can effectively serve as the opening topic statement: “The purpose of this experiment is to measure gravitational acceleration by timing a freely falling object.” For complex topics, the purpose statement might better follow explanatory material: “...and the purpose of this experiment is to determine coefficient k in equation 10.” The statement’s placement is flexible, provided it appears where readers can readily comprehend it.
A well-crafted introduction accomplishes several goals: directing reader attention to the research area, providing necessary background, explaining how this context applies to the specific work, and clearly stating experimental objectives. This prepares readers for understanding the experimental process.
Procedure
Outline of Procedure
Begin by providing an overview of the experimental approach. If the experiment measured copper wire resistance variation with temperature between 20°C and 100°C, state this clearly to establish a framework for subsequent details. Starting instead with specific connections and instrument readings would quickly lose reader attention without this contextual foundation.
Specific Measurement Details
With the general experimental approach established, readers can now appreciate specific measurement methodologies. Systematically describe how each required quantity was measured. Ensure no significant measurement approach is omitted; readers need to know whether we used a millisecond-precision electronic timer or a 0.2-second resolution stopwatch. Standard techniques may require only brief mention: “Resistances were measured using a Wheatstone bridge accurate to 0.01%.” We might discuss measurement accuracy here, while reserving discussion of overall experimental precision for later sections.
Precautions
After describing measurement methods, readers may wonder about potential errors inherent in these techniques. Assure them that we anticipated these issues and took appropriate precautions. Exercise judgment here—routine precautions need not be elaborated, but special measures taken to address significant error sources deserve mention before concluding this section.
Apparatus Diagrams
Well-executed apparatus diagrams substantially enhance report quality. While professional publications require polished illustrations, even student reports benefit from careful diagramming. Use straightforward tools like rulers to ensure neatness, with clear labels to aid comprehension. Good diagrams save considerable explanatory text and provide details that would be tedious to describe verbally. Reference diagrams at appropriate points in the text; an overview diagram works particularly well when introducing the procedure section: “Using the apparatus shown in Figure 1, we measured ball bearing fall times over heights ranging from 20 cm to 150 cm.” Figure 1 demonstrates an acceptable apparatus diagram.
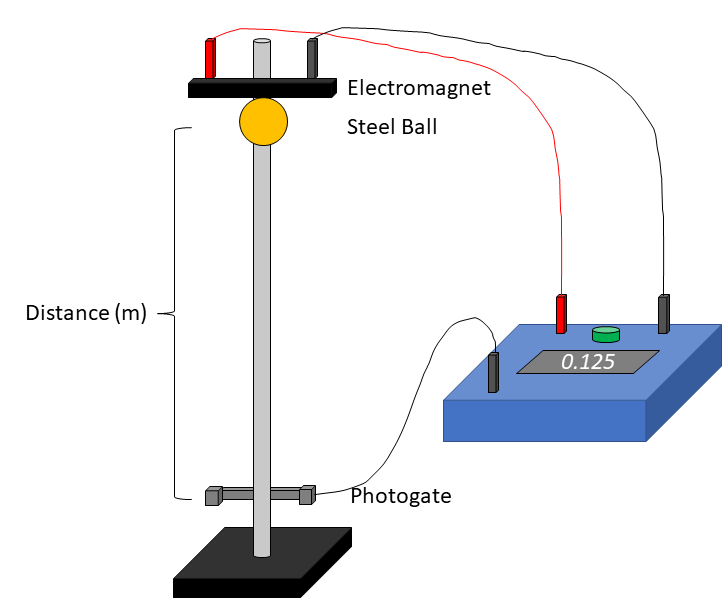
Figure 1:A free-fall apparatus diagram illustrating the experimental setup for measuring the fall times of objects dropped from various heights.
Results
Measured Values
By now, readers understand the experimental context and methodology, and are ready for the findings. Since most valuable experiments examine relationships between variables, results often benefit from tabular presentation, particularly when not directly comparing to mathematical models. Maintain high standards of clarity in tables, with comprehensive headers including variable names, symbols, and measurement units. Include uncertainty values with measurements unless addressed separately. Properly identify tables with numbers and titles. Reference any graphical representations straightforwardly: “Figure 2 shows time of fall versus height.” Place exceptionally detailed data tables in appendices to maintain narrative flow. Following primary results tables, list all other relevant measured quantities with their uncertainties and units.
Description of Measurement Uncertainties
Clearly specify what kind of uncertainties the values represent—whether estimated maximum limits or statistical measures like standard deviations. For statistical values, include the sample size. When reporting calculated quantities derived from measurements, explain the uncertainty calculation method without necessarily including arithmetic details, provided the approach is clear.
Computation of Final Answer
Well-designed experiments typically yield final results through graphical analysis. Explain the analytical approach explicitly. Even for straightforward analyses, be specific: “We determined resistance from the slope of the V versus I graph (Figure 3) between 0.5A and 1.5A.” If the result required additional calculations beyond graphical values, state this clearly: “We calculated the viscosity coefficient using the Q versus P graph slope combined with measured values of a and ℓ according to Equation (3).”
Similarly, explain the approach to uncertainty calculation. Whether we visually estimated slope ranges, combined multiple uncertainty sources, or employed least-squares methods with statistical analysis, describe the approach without burdening readers with extensive calculations. If detailed calculations seem necessary, place them in an appendix where interested readers can access them without disrupting the main narrative.
Graphs
The graphs created during analysis served as computational tools, potentially requiring large formats and precise drawing for accurate measurement. However, graphs included in the report serve a different purpose—they illustrate results rather than providing readers raw analytical material. They help readers visualize system behavior and evaluate interpretations.
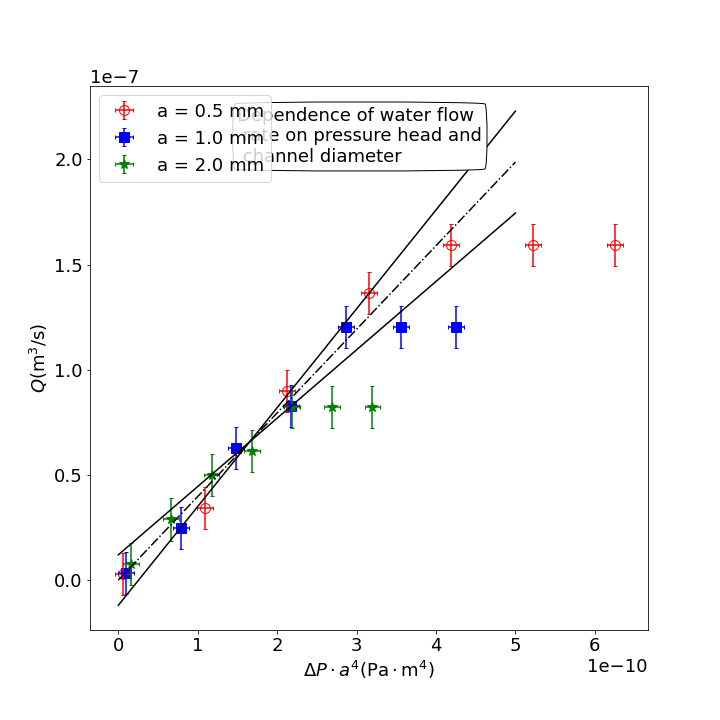
Figure 2:An example of a well-formatted results graph with clearly labeled axes, visible uncertainty indicators (error bars), and a properly identified best-fit line.
Report graphs should be clean, clear, and uncluttered. Plot points with visible uncertainty indicators (boxes or crosses) and clearly label axes. Identify uncertainty types and axis symbols directly on or near the graph to avoid forcing readers to search the text for interpretation. Avoid cluttering graphs with calculation details. Each graph should have a descriptive title or extended caption that can also incorporate important technical details. Figure 2 demonstrates acceptable graph formatting.
Discussion
Comparison Between Model and System
The discussion constitutes an integral report component rather than an afterthought. Here we address the fundamental experimental question—the relationship between system and model. This comparison’s outcome represents a critical experimental result that readers eagerly anticipate.
Having evaluated results objectively during analysis, present an unbiased assessment of system-model correspondence. Make a straightforward factual statement about what we observed. For example: “The model described by Equation (1) predicts a linear Q versus P relationship passing through the origin. Our experimental results show linear behavior through part of the range, but with a non-zero Q-axis intercept. Additionally, at higher P values, measurements systematically deviate from linearity beyond measurement uncertainty.”
Begin with this objective assessment before proceeding to interpretation. Since system-model comparison represents the experiment’s fundamental purpose, clearly state the actual results before introducing subjective elements.
This factual statement will naturally raise questions that require attention.
Consequences of Discrepancies Between Model and System
Readers will wonder whether model-system discrepancies affected the final results. Address how we protected conclusions from potential errors arising from these discrepancies. Explain, for instance, how an unexpected intercept didn’t compromise results derived solely from slope analysis, or how nonlinearity didn’t affect conclusions drawn from the linear region. Demonstrate how the experimental approach safeguarded results against such complications.
Speculation Concerning Discrepancies Between System and Model
Earlier report sections emphasized objective reporting of observations and processes. Now, however, we should introduce thoughtful interpretation. Having informed readers about system-model correspondence and protected results from discrepancy-related errors, we’ve fulfilled core experimental responsibilities. However, readers will naturally be curious about any observed discrepancies. Since we selected a model expected to match the system closely, discrepancies warrant explanation. As the people most familiar with the experiment, we’re uniquely positioned to interpret unexpected observations.
Some discrepancies have readily identifiable causes. Flow rate measurements deviating from linearity at high pressure differences might confidently be attributed to turbulence onset. If detecting turbulence was an experimental objective, this observation fulfills the purpose. In other cases, more extensive interpretation may be needed. If measuring viscosity was the primary goal, readers might question why we didn’t avoid conditions where laminar flow theory fails. Perhaps turbulence appeared at unexpectedly low pressures; candidly acknowledge this and consider potential causes.
When confronting genuinely puzzling discrepancies, speculation remains valuable even if limited. Our insights, even tentative ones, likely benefit other researchers given direct experimental experience. Conversely, if we cannot offer constructive ideas despite careful analysis, honest acknowledgment of unresolved discrepancies between well-established systems and models can itself contribute meaningfully to scientific discourse.
When speculating about discrepancies, maintain scientific responsibility. Rather than offering disconnected hypotheses, develop interpretations logically connected to observed patterns. For instance: “The T² versus m plot’s non-zero intercept at m=0 suggests the presence of additional unaccounted mass in our system.” Identifying the specific source is less critical than recognizing the logical implications of observations. Such reasoned inference facilitates further investigation by providing a structured framework for subsequent research.
Glossary
- laboratory report
- A formal document presenting the methodology, results, and conclusions of an experiment.
- introduction
- The section of a laboratory report that establishes the context and purpose of the experiment.
- procedure
- The section of a laboratory report describing the experimental methods and equipment used.
- results
- The section of a laboratory report presenting the data and calculations from the experiment.
- discussion
- The section of a laboratory report analyzing the results and comparing them to theoretical predictions.
- conclusion
- The section of a laboratory report summarizing the findings and their significance.
- error bar
- A graphical representation of the variability of data used on graphs to indicate the uncertainty in a reported measurement.